16 Oct 2026
Tracing Equations from Historical Hands to Current Tournament Payout Designs
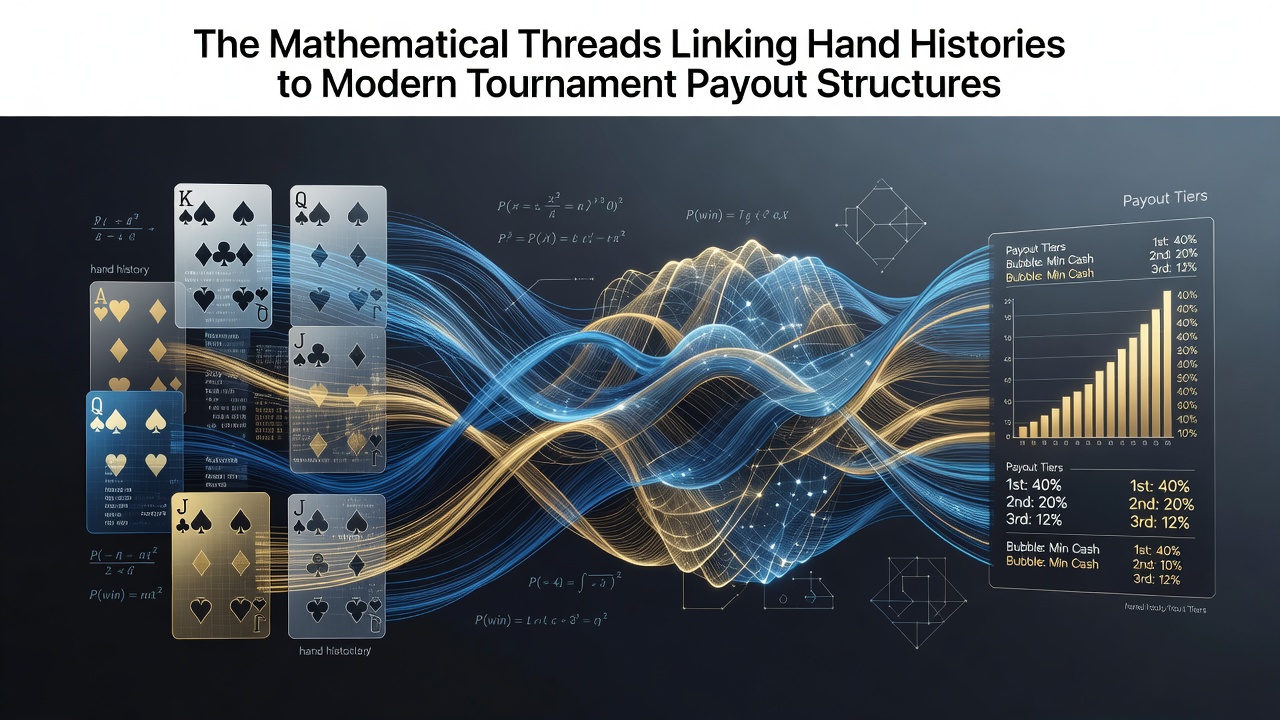
Researchers in game theory and probability have long examined how large datasets of past poker hands shape the algorithms that determine modern tournament payout structures, and the connections run through concepts like independent chip model calculations and expected value distributions. Data from millions of recorded hands allow analysts to refine models that predict player survival rates at various stack depths, while payout ladders in events with guarantees exceeding several million dollars rely on these refined estimates to balance risk and reward across fields that often exceed ten thousand entrants.
Hand History Archives as Foundational Data Sources
Comprehensive repositories maintained by major online platforms and live tournament operators compile hand histories that stretch back decades, and these collections feed directly into statistical frameworks used for payout optimization. Analysts process variables such as preflop raise frequencies, continuation bet success rates, and showdown percentages to generate distributions that inform how chips translate into real-money prizes at each elimination stage. Studies from institutions including the University of Alberta's poker research group have demonstrated that incorporating historical frequency data reduces variance in payout projections by measurable margins when compared with purely theoretical models.
One dataset released in 2023 by a European gaming analytics firm tracked over 150 million hands from major series, revealing patterns in late-stage play that directly influence how organizers set minimum cash thresholds and final table payouts. Those patterns show that shorter stacks tend to fold more often than earlier models predicted, which in turn adjusts the independent chip model multipliers applied to remaining players. Observers note that such adjustments appear in schedules for events scheduled through October 2026, where preliminary payout tables already reflect updated survival curves derived from the same historical inputs.
From Raw Data to Payout Formulas
Modern payout structures emerge when programmers integrate regression analyses of hand outcomes with chip utility functions, and the resulting equations determine prize allocations that minimize player dissatisfaction while meeting guarantee requirements. Researchers apply Monte Carlo simulations seeded with hand history statistics to forecast the number of players reaching each payout tier, then calibrate the percentage of the prize pool awarded at those tiers. Evidence from industry reports indicates that tournaments using these simulation-driven structures experience fewer complaints about pay jumps than events relying on older flat-percentage models.
What's interesting is how small shifts in historical aggression metrics can cascade through the entire ladder. When datasets show an increase in three-bet shoving ranges over a five-year period, simulators adjust the survival probabilities for mid-stack players, which often leads organizers to compress the payout spread between 50th and 20th place. Australian Competition and Consumer Commission documentation on gaming product approvals highlights similar data-driven revisions in regional festival structures, where historical hand trends inform decisions on whether to add additional paid positions or deepen the top-heavy awards.

Integration with Live and Online Tournament Operations
Operators running both live circuits and online qualifiers now feed real-time hand data back into their payout engines, creating feedback loops that refine structures between festival stops. For the October 2026 schedule, several major series have announced preliminary tables that incorporate hand data collected through mid-2025, particularly from high-roller events where sample sizes remain smaller yet more consistent. This practice allows for incremental tweaks to bubble factors and final-table payout ratios without requiring complete redesigns of the prize distribution.
Trade associations such as the European Gaming and Betting Association have published guidelines recommending that members archive at least three years of hand histories before finalizing payout formulas for flagship events. The guidelines emphasize verification steps that cross-reference simulation outputs against actual elimination sequences observed in prior years, ensuring the mathematical threads remain anchored in observed play rather than abstract assumptions. Figures released by the association show that members adopting these verification protocols report closer alignment between projected and realized payout distributions.
Academic and Regulatory Cross-Checks
University-led projects continue to test the robustness of these linked models against edge cases, such as fields with unusual stack distributions or unusual player demographics. A 2024 paper from a Canadian research consortium examined how hand-history-derived aggression indices affect payout equity in short-stack heavy tournaments, and the findings prompted several organizers to widen pay jumps near the middle of the field. Regulatory bodies in multiple jurisdictions require operators to document the data sources feeding their payout algorithms during licensing renewals, which further encourages transparent use of historical records.
Those who've studied the evolution of these systems observe that the integration of hand histories has become standard practice rather than an optional enhancement, and the trend shows no sign of reversal as computational power increases. The mathematical threads therefore continue to tighten, linking every recorded hand to the precise dollar amounts awarded when players reach various stages of elimination.
Conclusion
The relationship between accumulated hand histories and contemporary tournament payout structures rests on iterative statistical modeling that converts observed frequencies into survival probabilities and equity distributions. As new data streams enter the system each season, including those expected before the October 2026 events, the formulas adapt while maintaining core connections established through years of recorded play. This ongoing refinement supports consistent prize allocation across diverse tournament formats and field sizes.